Enact’s platform is making it easy for users to model NEM 3.0 rates. In December, the California Public Utilities Commission (CPUC) approved the much anticipated Net Energy Metering (NEM 3.0), which brings significant changes for homeowners and businesses installing solar PV systems in California. These changes will go into effect on April 15, 2023 and at Enact we have made it very easy for users to start comparing the effects of NEM 3.0 versus NEM 2.0.
To help our users on Enact understand how to approach the ROI impact of NEM 3.0, we have modeled a typical residential home with different size configurations of solar / storage to showcase the impact of NEM 3.0 rates on average payback, for all the three major California investor-owned utilities (IOUs).
We picked a residential example with 32 kWh of average daily load, and a load pattern as shown below on Figure 1, with total electricity consumption of 12,000 kWh per year.
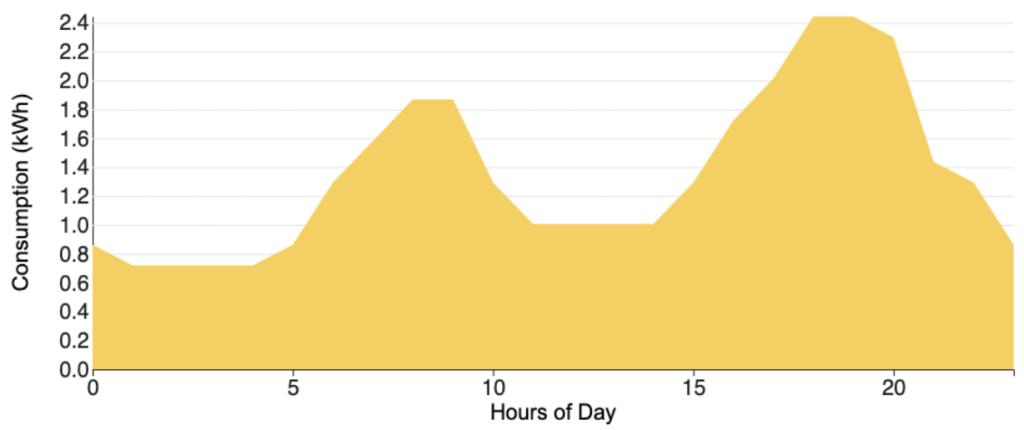
Figure 1: Average daily consumption pattern of the home
We then modeled the addition of an 8 kW rooftop solar system priced at $24,000 ($3 per Watt). As shown below on Figure 2, this system exports 62% of the energy on an average daily basis.
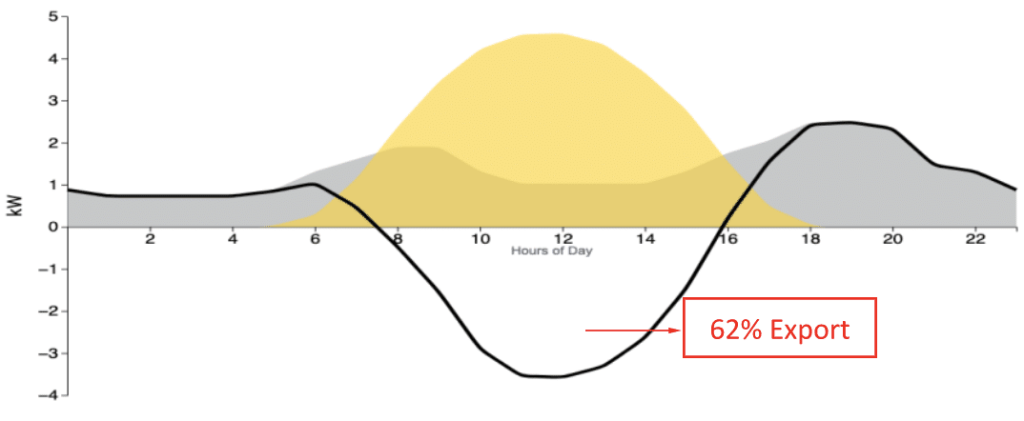
Figure 2: Solar-only scenario (8 kW system)
We then modeled the addition of two battery scenarios. Figure 3 below shows a 10 kWh battery, priced at $15,000 installed, which exports 37% of the energy on an average daily basis.
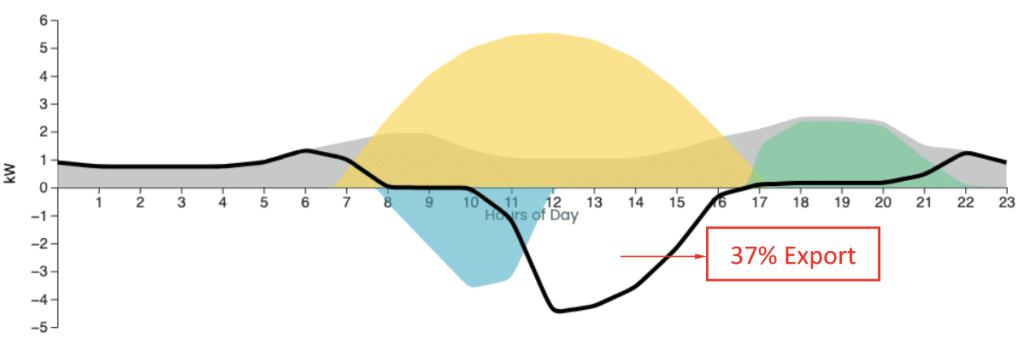
Figure 3: Solar-plus-storage (8 kW plus 10 kWh battery)
Finally, Figure 4 below shows a 20 kWh battery addition — priced at $23,000 installed — which exports 20% of the energy on an average daily basis.

Figure 4: Solar-plus-storage (8 kW plus 20 kWh battery)
The higher the size of the battery, the lower the export of solar energy to the grid – hence it’s important to look at the impact size of the battery.
The results are all shown below for three different California utilities: PGE, SDG&E and SCE. While the numbers vary from one utility to the other due to difference in electric rate tariff schemes as well as solar production, the conclusions are pretty clear.
- Solar plus storage paybacks: While the payback of solar-only systems reduces significantly from NEM 2.0 to NEM 3.0 (almost double the number of years), the payback of solar-plus-storage systems worsens by only 1-2 additional years due to NEM 3.0.
- Larger storage systems fare better on payback in the NEM 3.0 world: A 20 kWh storage unit only adds three months to the payback cycle, compared to a 10 kWh storage unit. In the NEM 2.0 world, a 20 kWh storage unit would add 12-18 months to the payback versus a 10 kWh storage unit.
- Utility bill offsets max out at approximately 85-88% in the NEM 3.0 world and it’s difficult to achieve the 98-99% bill offsets in the NEM 2.0 world.
The reasons behind the above are all driven by the structure of the NEM 3.0 rates, designed to penalize solar exports. Storage definitely helps improve the payback — storing the excess solar and reducing exports, which pays off better for the customer.
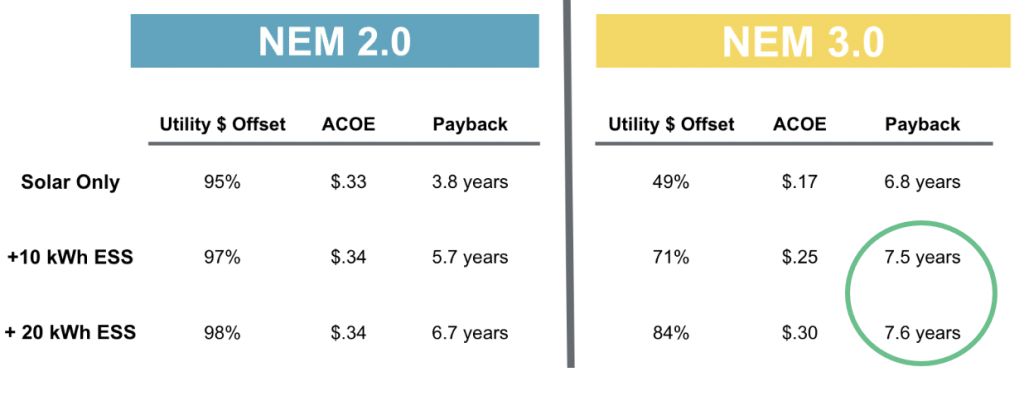
Figure 5: Pacific Gas and Electric – 8 kW solar plus storage scenarios (~104% energy offset)
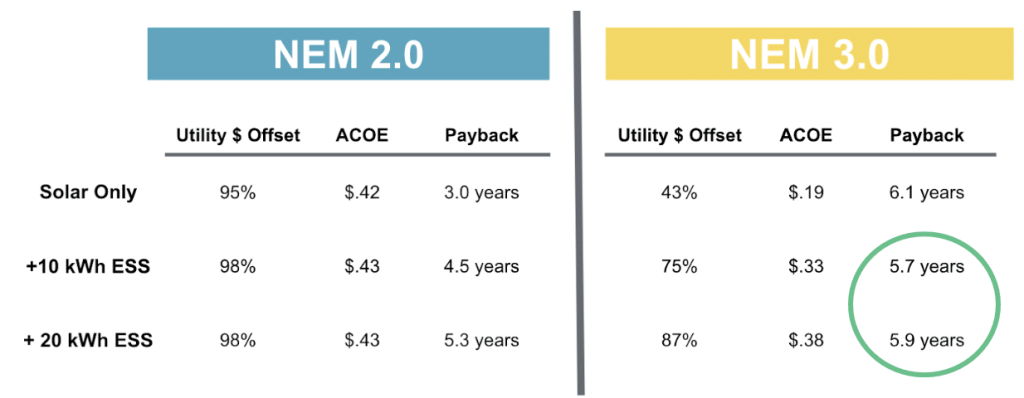
Figure 6: San Diego Gas & Electric – 8 kW solar plus storage scenarios (~107% energy offset)
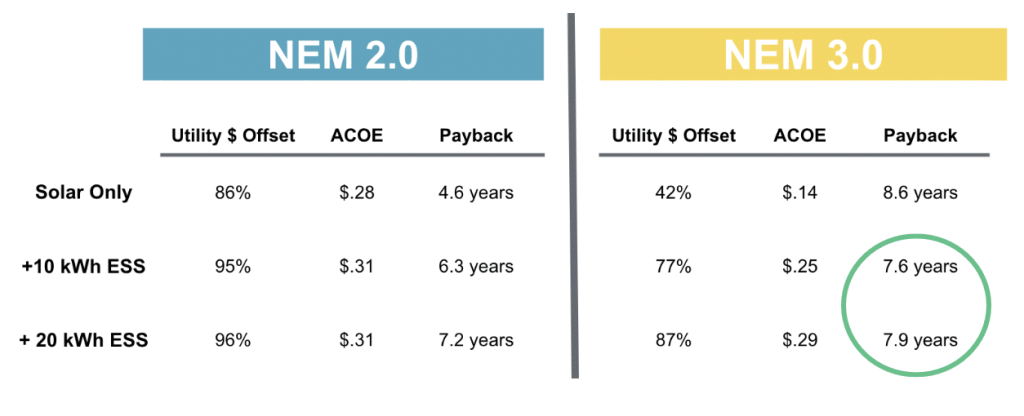
Figure 7: Southern California Edison – 8 kW solar plus storage scenarios (~108% energy offset)
The above scenarios are based on an approximate 104-108% energy offset. The paybacks are very different if the solar / storage system is undersized or oversized. As shown on Figure 8 below, for the same house with small solar systems (e.g. 4 or 6 kW solar, versus 8 kW), the same 10 or 20 kWh storage system can reduce exports to near 0%, maximizing ROI.

Figure 8: PV Exports versus System Size – PGE Scenario (12,000 kWh per year)
As sales professionals, the job becomes much harder to explain such choices to the customers buying solar and storage. Needless to say, many solar professionals avoid bringing up payback at all when selling the battery – but that is not necessarily serving customer interest!
Consumers spending tens of thousands of dollars on energy storage upgrades deserve to know the ROI of their investment — in addition to buying into the “backup power” benefits.
Enact’s platform makes it very easy for solar sales professionals to select their battery options, and price / design / sell systems confidently with easy-to-generate proposals.
Enact also offers a powerful Consumer App that measures solar / storage savings live in dollars, adding a whole new level of comfort to the customer’s buying journey.
Sign up for Enact’s platform today!


