A market research report into the California residential solar market
Abstract
This research report delves into California’s residential solar market, investigating factors driving adoption among homeowners in different regions and income brackets. Conducted by Enact’s marketing team via an online survey, the study analyzed responses from 482 homeowners with installed solar systems.
Key findings indicate that higher-cost solar systems (over $25,000) are more likely to require maintenance. Higher income participants display increased interest in solar monitoring apps and frequent notifications. While “saving money” is a primary motivation, higher-income participants consider grid independence and environmental factors. Satisfaction with installers and monitoring apps is high, and 80%+ would refer others for financial incentives.
This research offers valuable insights for the residential solar industry, informing professionals about market trends, customer preferences, and areas for enhancing the customer experience. The study emphasizes the impact of cost, income, region, and system age on behaviors and motivations among California solar homeowners.
Executive Summary
This research was able to identify the behavior and characteristics that have motivated the purchase of solar systems by region and income of homeowners.
Among the main points that were defined were: reasons for going solar, method of payment for acquisition, required maintenance, interest in improvement, engagement, and satisfaction from installation to follow-up in its monitoring application.
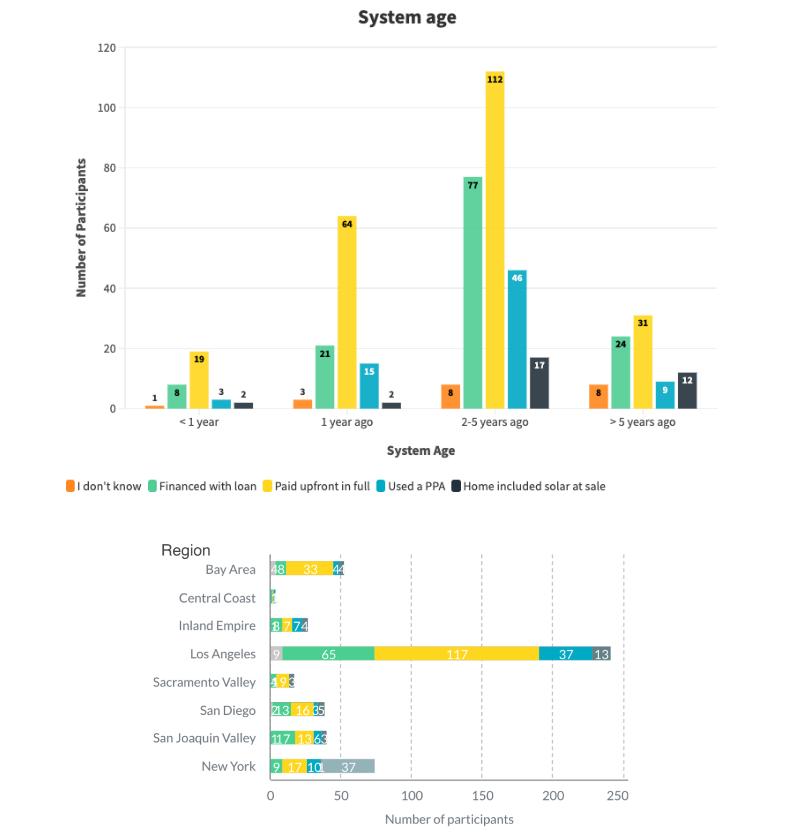
The participants of this research were represented as follows: 61.20% men, with a predominant income of $100,000 to $149,999. In addition, 54% of participants have installed their equipment with a date range between 2 and 5 years with an average of 10 to 20 solar panels by 54.98% of the participants. On the other hand, another characteristic is that 66.81% of the participants commented that their system had a total cost between $15,001 to $35,000 before credits, however only 27% used a loan and 47% paid upfront in full. Over 54% of participants were from the Los Angeles region.
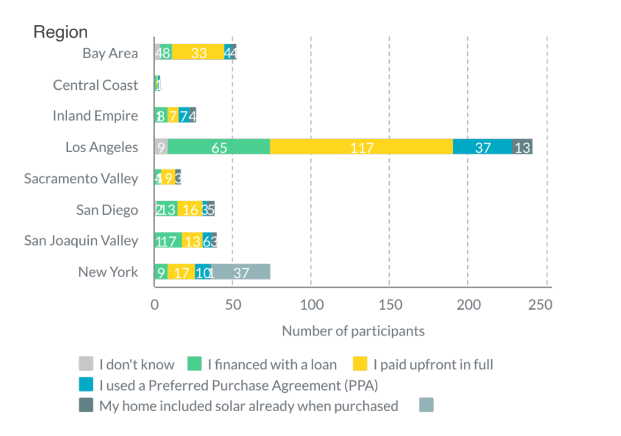
The study identified that financing becomes more attractive when the cost is higher than $35,000 and Inland Empire and San Joaquin Valley were the only two regions that preferred to finance their system first with a loan rather than full payment.
On the other hand, the predominant reason for going solar is to “save money” especially for small systems, low-income earners and new buyers. In contrast, high-income earners tend to be interested for other reasons, such as “Peace of mind with supplying my own power”, “Environmental considerations” or “To be able to charge my electric vehicle”.
In addition lower income buyers are anxious/unsure about savings and higher income earners are more confident about it. The same response was obtained when asked about satisfaction with their solar installation, the performance of their system, and their monitoring app.
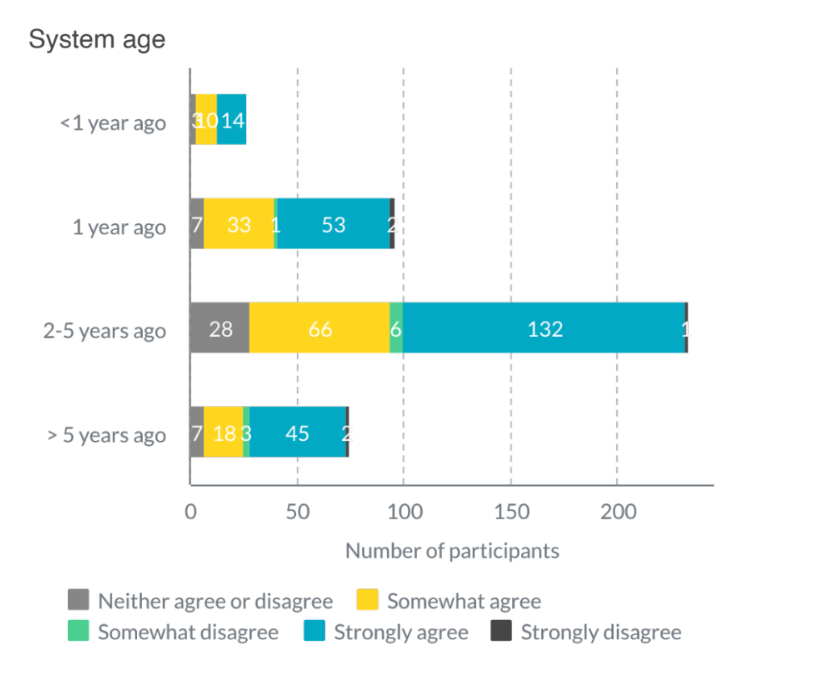
Similarly, it was identified that the newer the system, the higher the perception of savings than those who have had their system for more than five years.
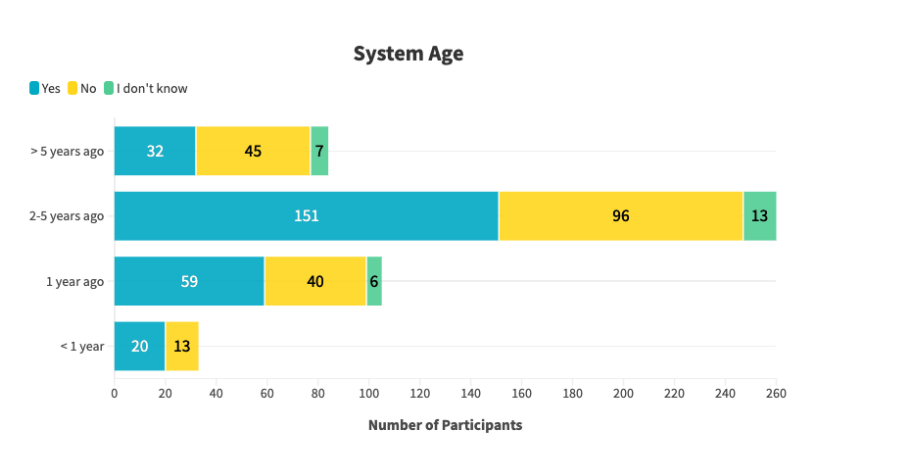
While on the maintenance aspect, more than half will use it in the first two years, and if the system is expensive, it is more likely to be used earlier.
In addition, 81% of participants are interested in upgrading their solar system, and it was found that one-third of participants would add at least one asset to upgrade their system, primarily a storage battery, followed by more solar panels, and only one-tenth would add four assets. And finally, regarding the use of their monitoring app, 66% use it daily or weekly. And it was found that the higher the income the more likely to opt for “daily” notifications, as well as the younger participants, and new buyers. In total 91% want to receive monthly, weekly or daily notifications and 67% prefer to use a mobile app. As a last point and for future research, it is important to consider homogenizing the participants by region.
What were the key objectives?
The research into California’s residential solar market consisted of three key objectives regarding the needs, experiences and behaviors of California solar homeowners. These objectives guided the collection and analysis of consumer survey information. The aim of these key objectives was to provide residential solar professionals insights into the largest solar market in the U.S.
The first objective was to understand the needs and experiences of homeowners in California who already have a solar system installed. Next, the second objective was to determine consumer pain points and identify unattended areas in the sales process. Lastly, the third objective was to determine the demographics and behavior of homeowners during the purchase of solar systems.
Our methodology and overview
This research was conducted over a 20 day period in the second quarter of 2022. This research is made by Enact’s marketing team. Our survey was administered online, using SurveyMonkey, and consisted of 879 participants answering 35 questions. After a series of logic questions, we removed unqualified participants from the study sample. Our final sample consisted of 482 participants who were homeowners with an installed solar system in either California or New York.
The information is confidential and after final payment becomes the property of the company. The information contained in this report will not be made available to third parties without the express authorization of the company.
Sources of information include:
- Surveys conducted online from a third-party using a purchased panel of randomized participants.
- Survey panelists were homeowners in California who have solar panels installed on their roof.
Responses were then studied using statistical analysis, visually portrayed throughout the research study. Additionally, we performed a sentiment analysis on responses for the final question, exploring what consumers could change in their solar purchasing process.
Every effort is made to provide accurate information. The information provided is the “best available” on the day the data was collected. Some survey participants elected to not answer every question in the survey.
Market Segmentation
Through our research, we were able to identify consumer demographics from our sample of solar homeowners, mainly in California. Our survey took into account survey participants’ age, gender, annual income, geographic location and when their solar panels were installed.
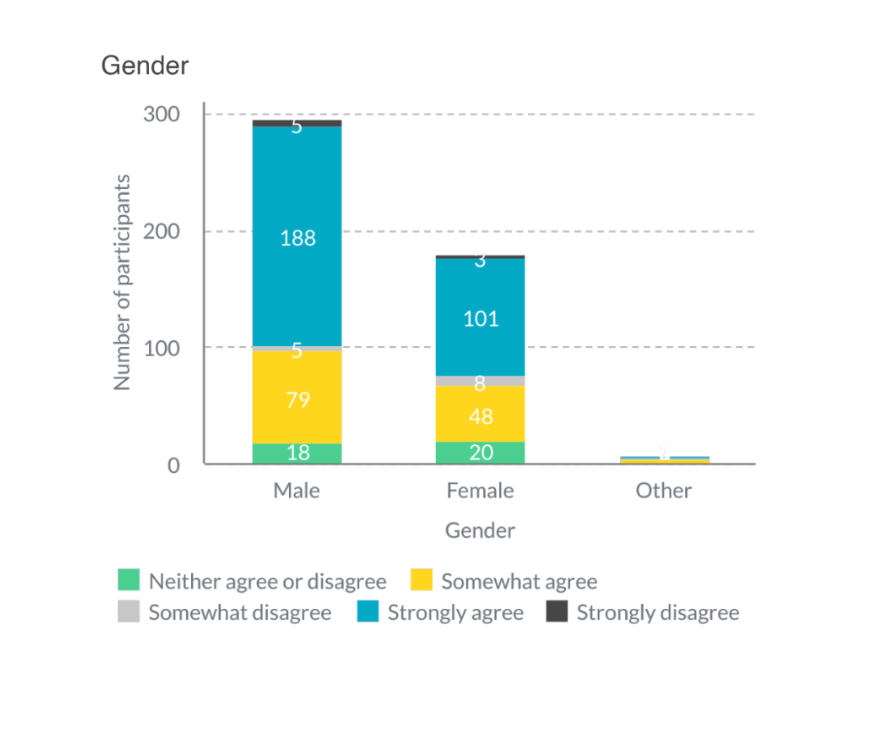
The majority of survey participants were aged 30-44 years old, representing over 57.18% of our sample. The sample was predominantly male, consisting of 61.2% male, 37.34% female, 0.62% other/gender non-binary and 0.83% preferred not to say.
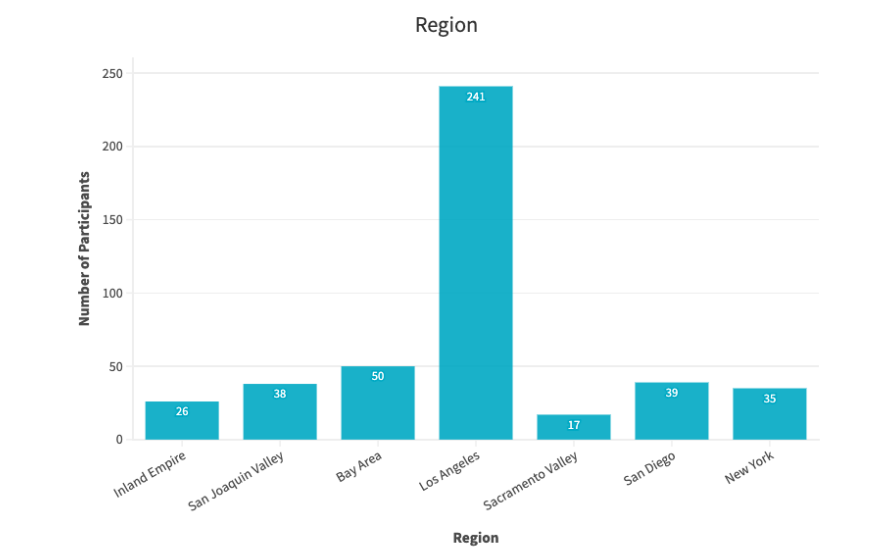
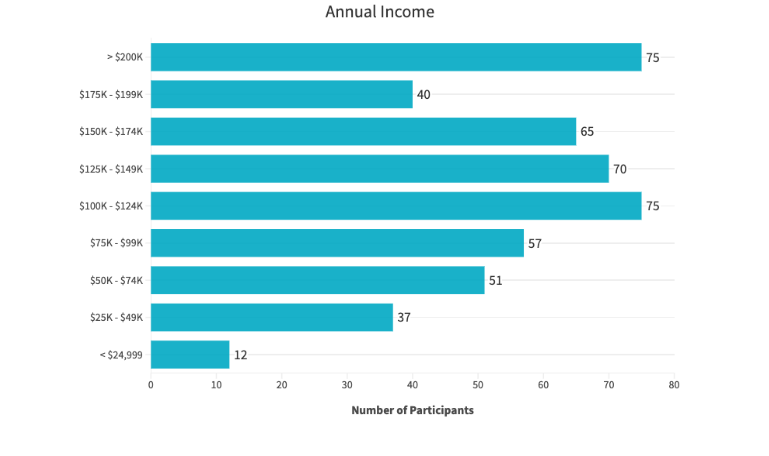
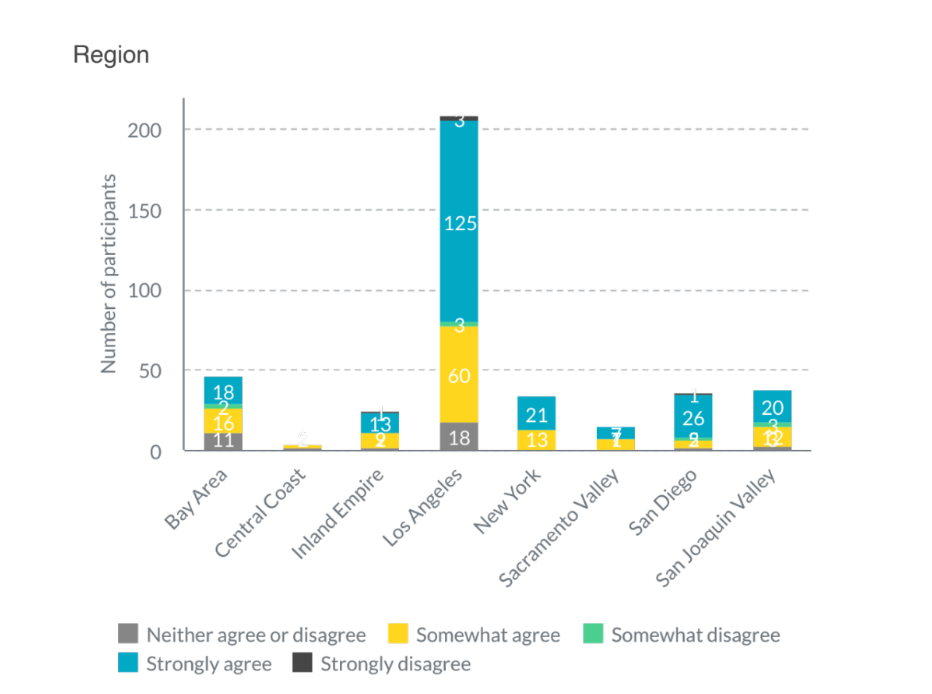
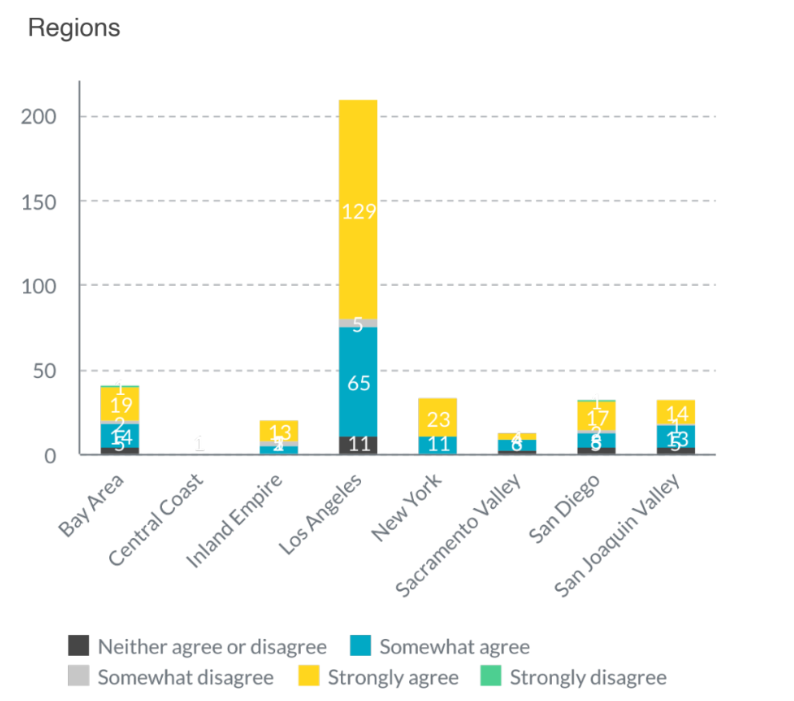
When examining annual income, the majority of survey participants reported earning more than $100,000. The region with the highest number of participants was the Los Angeles region which represented over 54% of the sample — followed by the Bay Area, San Diego region and San Joaquin Valley.
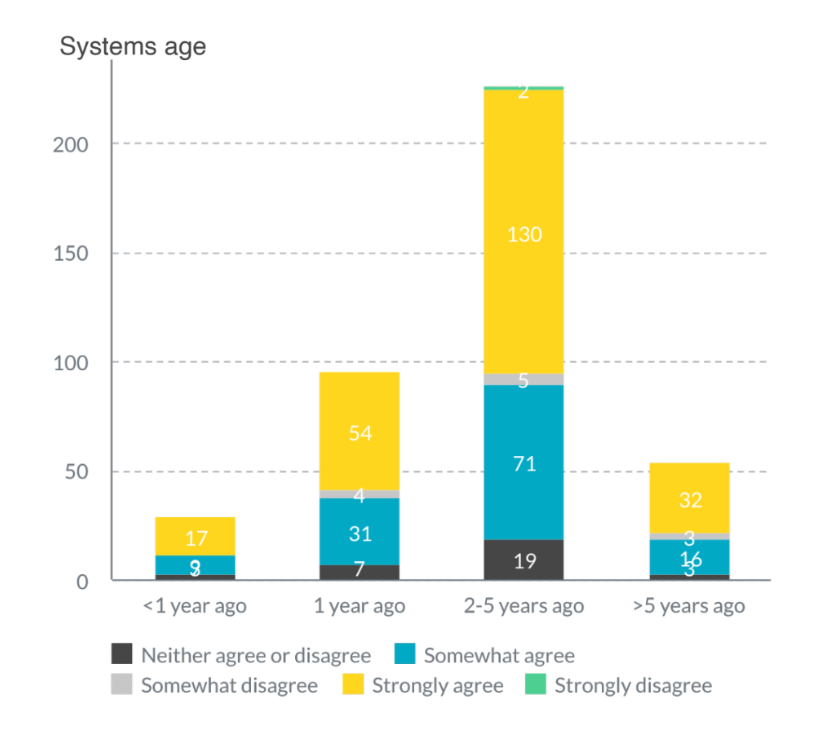
The majority of participants, at 53.94% had their solar system installed between 2-5 years prior to the 2022 survey. Based on the survey, 6.85% of participants had their solar system installed within the previous year, 17.43% of participants had their system installed more than five years before the study and 21.78% of participants had their system installed 1-2 years before the study.
Our sample represented a range of annual income levels, with individuals earning under $24,999 to those exceeding $200,000. For context, the U.S. Census reported the median household income in California from 2017-2021 to be $84,097 per year (2021 dollars).
What are the key takeaways?
Enact identified nine key takeaways from our 2022 California solar homeowners survey. We were able to answer our three key objectives through our research and summarized our findings, which may provide important consumer insights to solar businesses operating in California.
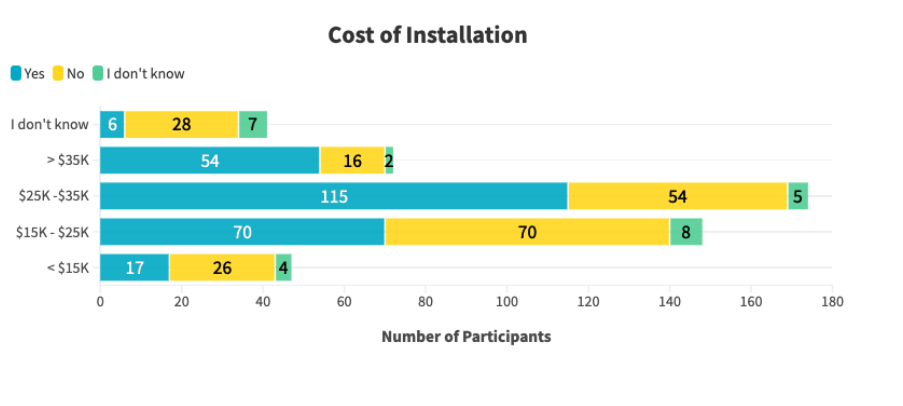
- Solar systems that cost over $25,000 are twice as likely to require maintenance as lower-cost systems.
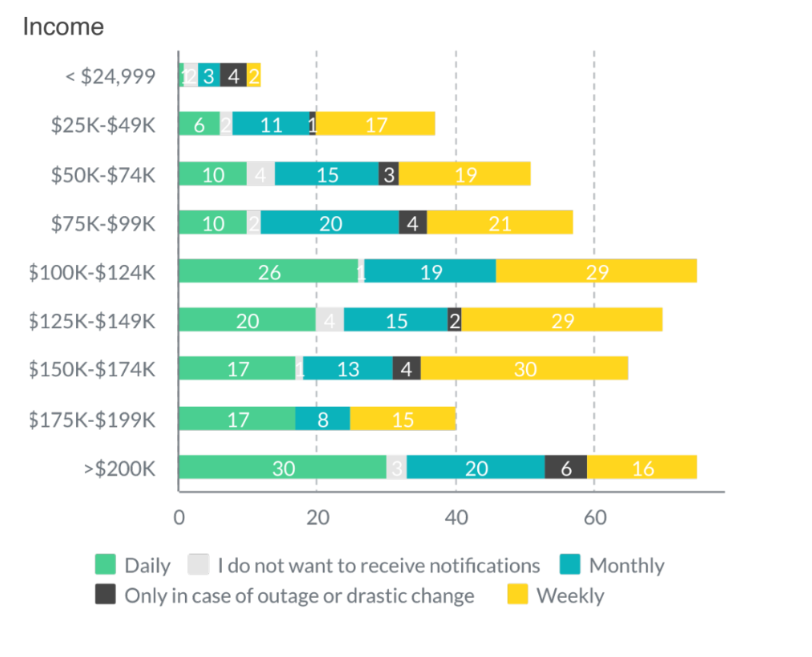
- The higher the income the more frequent they would like notifications (daily/weekly) from their solar monitoring app and use their app more frequently
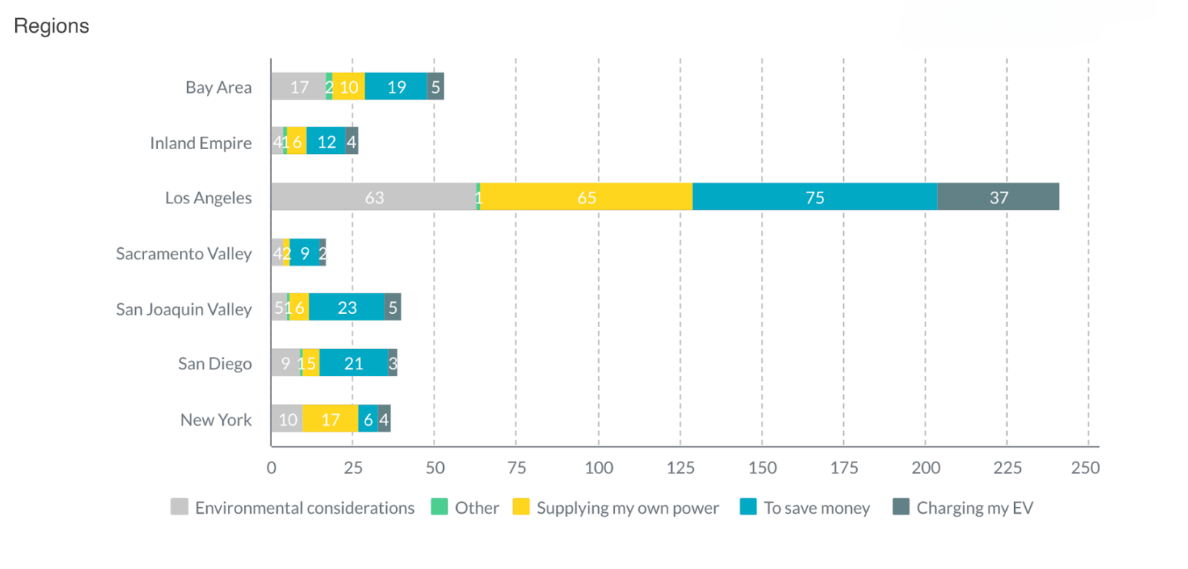
- More than half of the participants who chose “to support my EV” (electric vehicle) as their motivation for going solar are in the Los Angeles region.
- The majority of participants who have the solar monitoring app use it on a daily basis.
- The higher the income, other motivations are considered, such as grid independence and environmental factors.
- Lower income buyers are anxious/unsure about seeing utility savings from their solar system and higher income buyers are more confident about seeing utility savings.
- When the system cost more than $25,000, the major motivation for going solar was: “Peace of mind with supplying my own power.”
- Nearly 50% of participants reported being willing to refer someone to adopt solar for a financial incentive.
- Over 80% agree to the statement “the Inflation Reduction Act makes me more inclined to buy electric appliances in addition to my solar system”
h3>Market Analysis
How did you pay for your solar system?
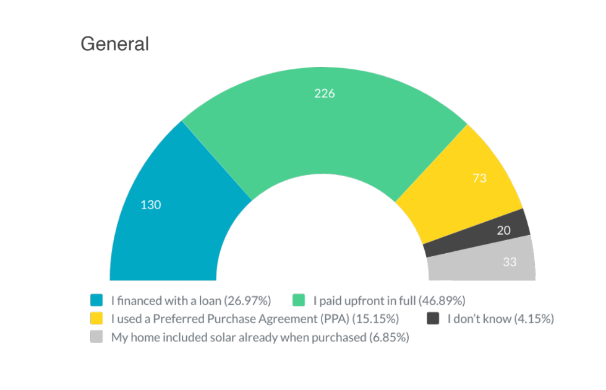
When viewing general results, we found 46.89% of homeowners paid for their solar system upfront. 26.97% of respondents paid for their system through financing a loan. General results also showed 15.15% of respondents used a PPA, 6.85% purchased a home with a pre-existing system and the remainder did not know.
High-income earners (over $100,000) were more than half as likely to make the full payment. New buyers are less likely to purchase with financing than those who bought two and five years ago
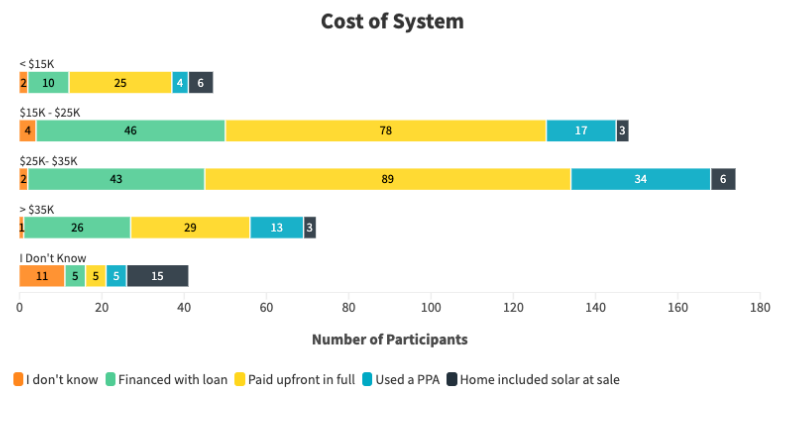
When the cost is above $35,000 more than half of the participants prefer to finance their system. We found the average cost of the systems is between $15,001 to $35,000. Slightly more than half at Inland Empire and San Joaquin Valley preferred to finance their system first with a loan rather than full payout.
Do you know the name of your inverter?
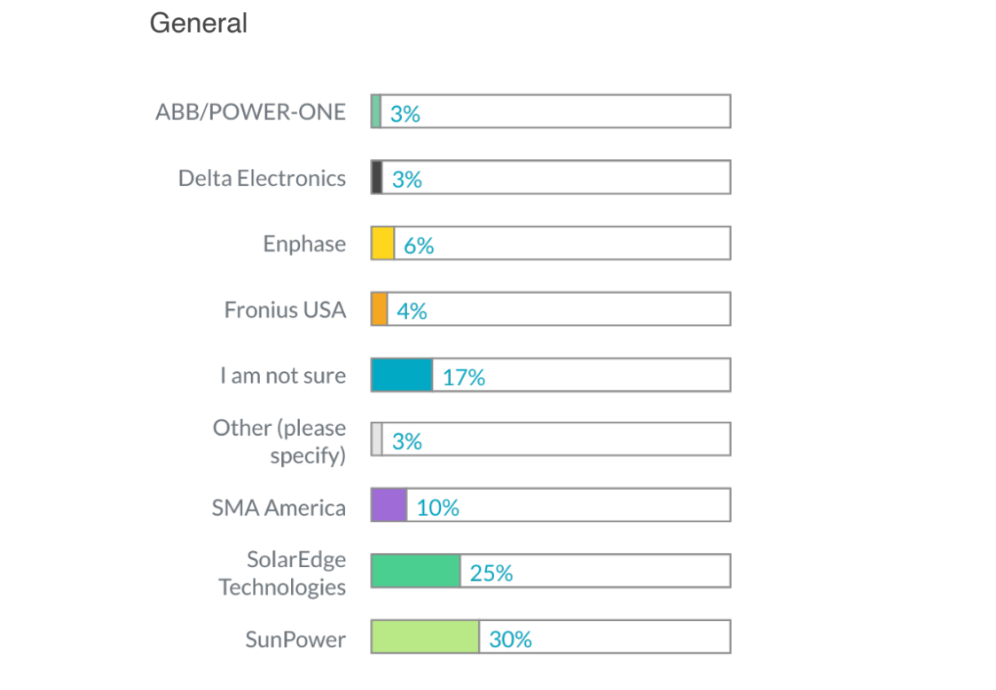
The majority of participants in our California solar homeowners survey were able to identify the name of their inverter manufacturer. The Bay Area and Sacramento Valley are unsure of their inverter’s name. Almost 40% could not identify their inverter manufacturer, compared to 17% of the all participants.
Participants are six times more likely to identify SolarEdge Technologies and SunPower than other inverter brands — combined being identified by 55% of participants. Both brands are the predominant inverter brands in the Los Angeles, Inland Empire and New York regions. Solar edge has almost no representation with recently purchased systems, installed in less than one year from the survey.
Motivation to go solar
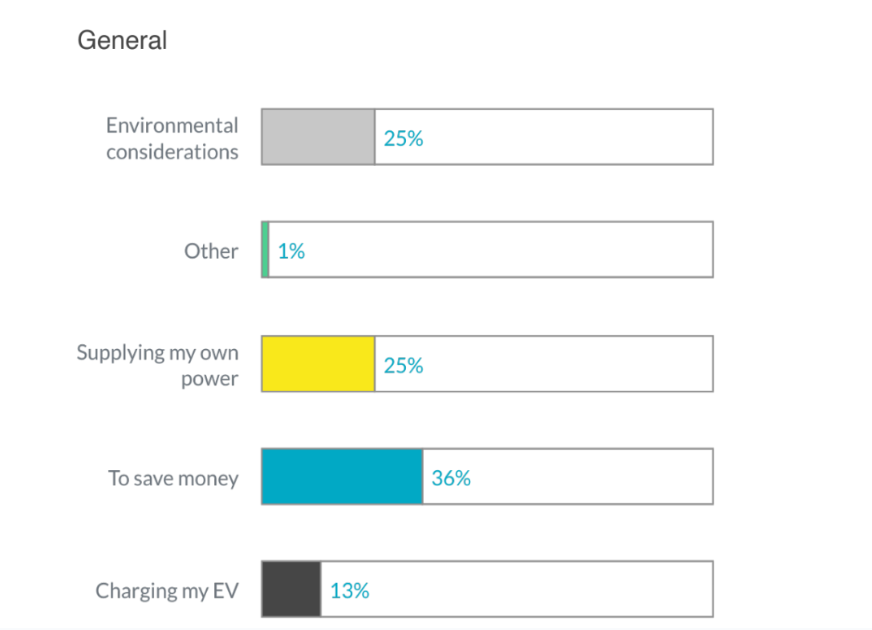
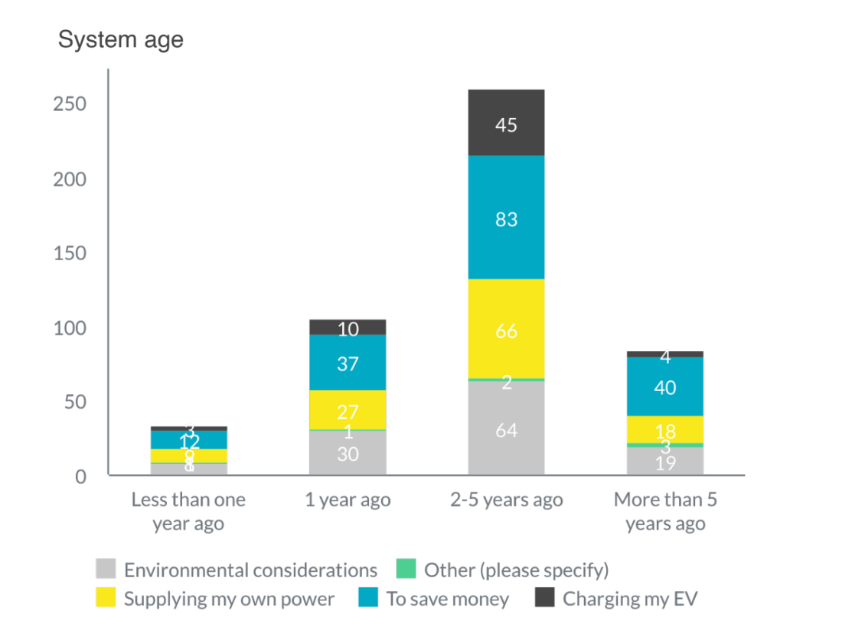
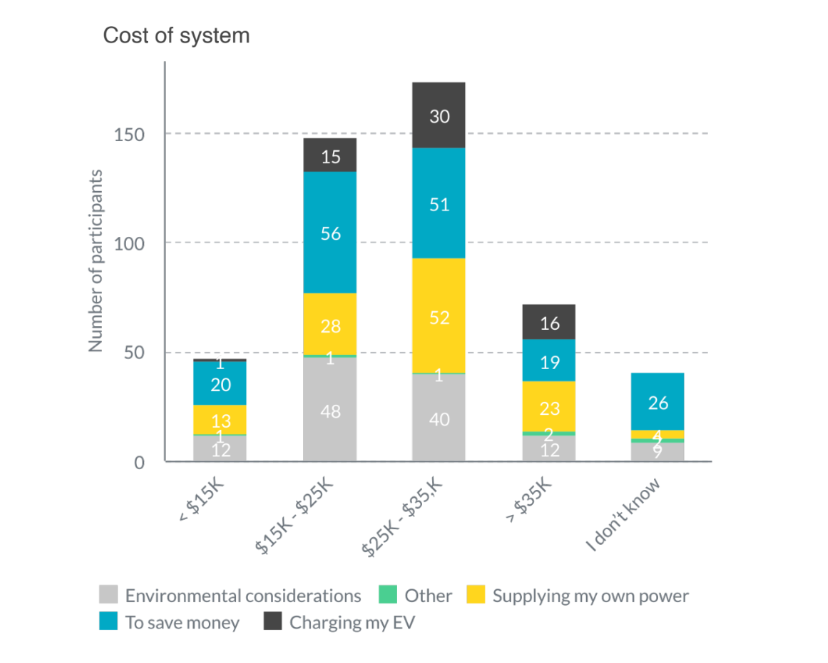
The largest motivation among all participants to adopt solar was “to save money” — at 36% of responses. This was followed by a tie — both at 25% — between “environmental considerations” and “supplying my own power.”
Low income earners were almost two times more likely to choose to “save money” as those with high incomes. The higher the income, other motivations were typically considered, such as grid independence and environmental factors. When the system cost more than $25,000, one of the major motivations for going solar was: “peace of mind with supplying my own power.” Over 17% of people with solar systems between 2-5 years old cited “charging their EV” as their motivation for adopting solar.
Solar homeowners in the Bay Area and the Los Angeles region were eight times more open to considering other options than “saving money.” Participants in the Inland Empire, Sacramento Valley, San Diego and San Joaquin Valley regions were above average in citing saving money as a motivation for going solar. New Yorkers selected the option “peace of mind with supplying my own power” as their number one option.
Aware of how much I am saving with my solar system
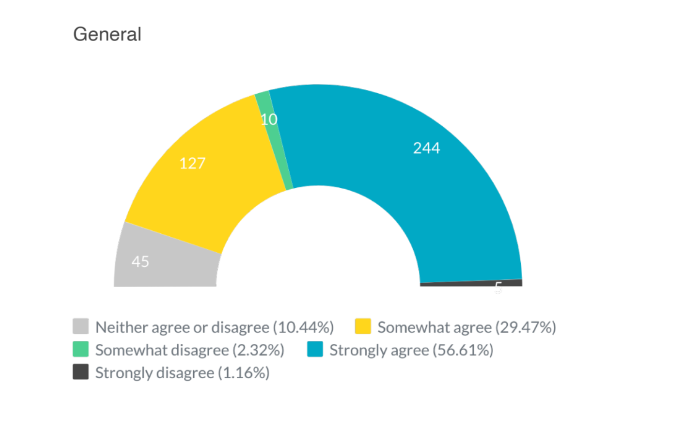
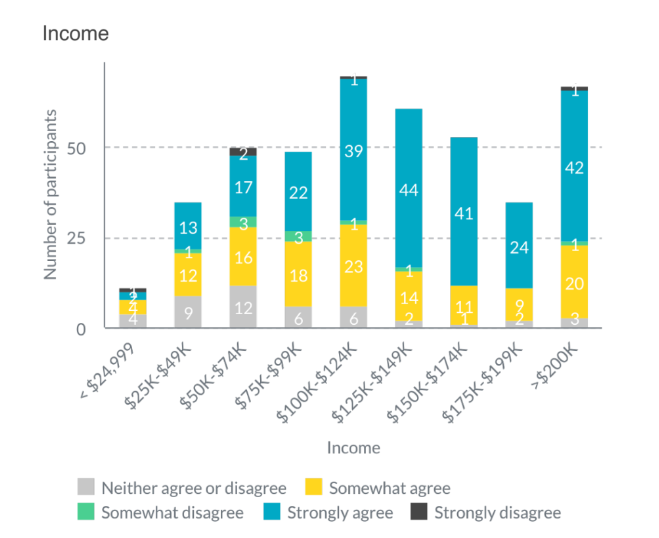
Over 86% of participants strongly or somewhat agreed to the statement that they are “aware of how much I am saving with my solar system.” 56.61% of participants strongly agreed and 29.47% somewhat agreed. Over 10% neither agree nor disagree with the statement. We found 2.32% somewhat disagreed and 1.16% strongly disagreed.
The higher the income, the more confident they know how much money they are saving with their system. Higher income earners are two times more likely to be aware of their savings, compared to those with lower incomes.
Lower income buyers are anxious/unsure about savings and higher income earners are more confident about it. The Bay Area is two times more likely to be uncertain about its energy savings compared to the other regions.
The Bay Area is 2x more likely to be uncertain about its energy savings compared to the other regions. Over 88% of Los Angeles solar homeowners strongly or somewhat agree to being aware of their solar savings. In the Bay Area, this number was 72% of participants.
My solar system is performing as promised
Along with awareness of savings, the majority of California solar homeowners in the survey agreed with the statement “my solar system is performing as promised.” 62.66% of participants strongly agreed and 25.41% somewhat agreed. When combining strongly and somewhat disagree, around 4.77% believe their system is not performing as promised. The remainder reported neither agreeing nor disagreeing with the statement.
San Diego, Inland Empire and New York are the regions where participants are above average in satisfaction. However, the Bay Area, Los Angeles and San Joaquin Valley are the regions that are below average in satisfaction. Lower income earners are slightly less satisfied than those with higher incomes.
Roughly how much is your electric bill after solar installation?
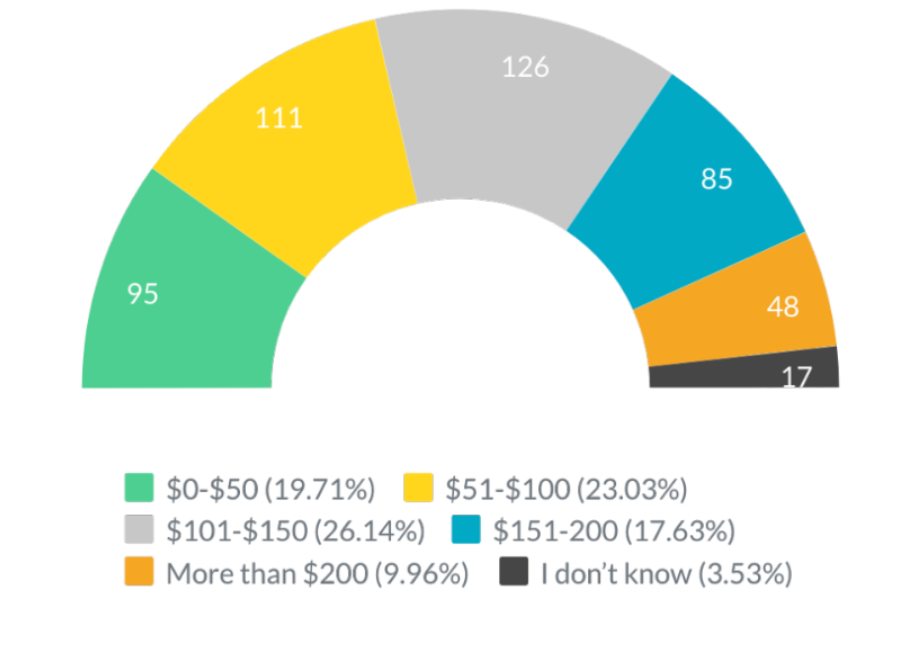
The majority of participants reported saving over $100 per month on their electric bill after adopting solar. The largest number, at 26.14% saved between $101-$150 per month. Over 23% reported savings of $51-$100 per month and 19.71% reported saving between $0-$50 per month.
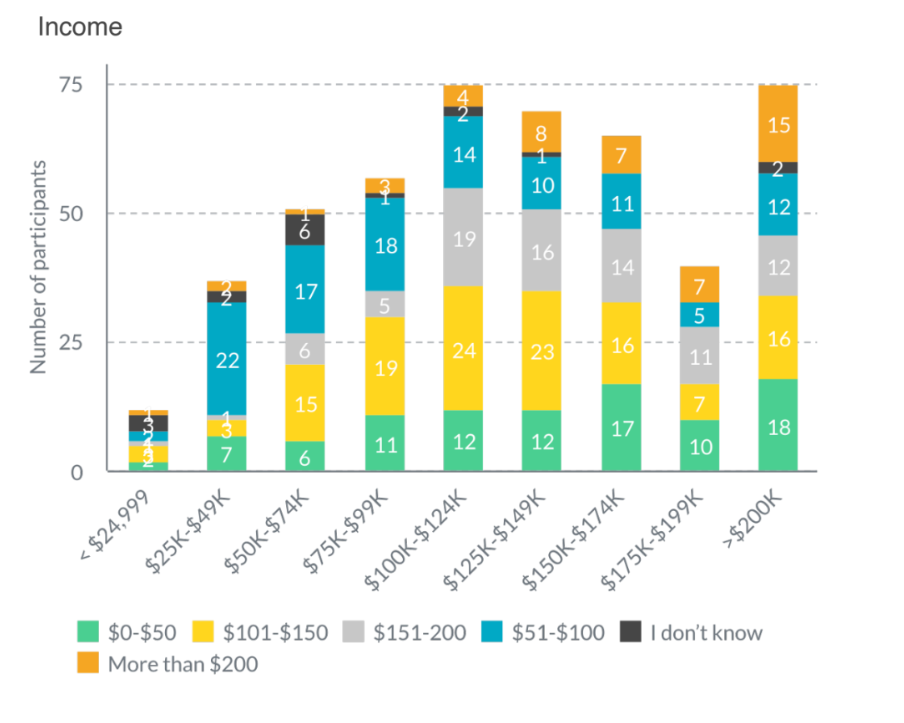
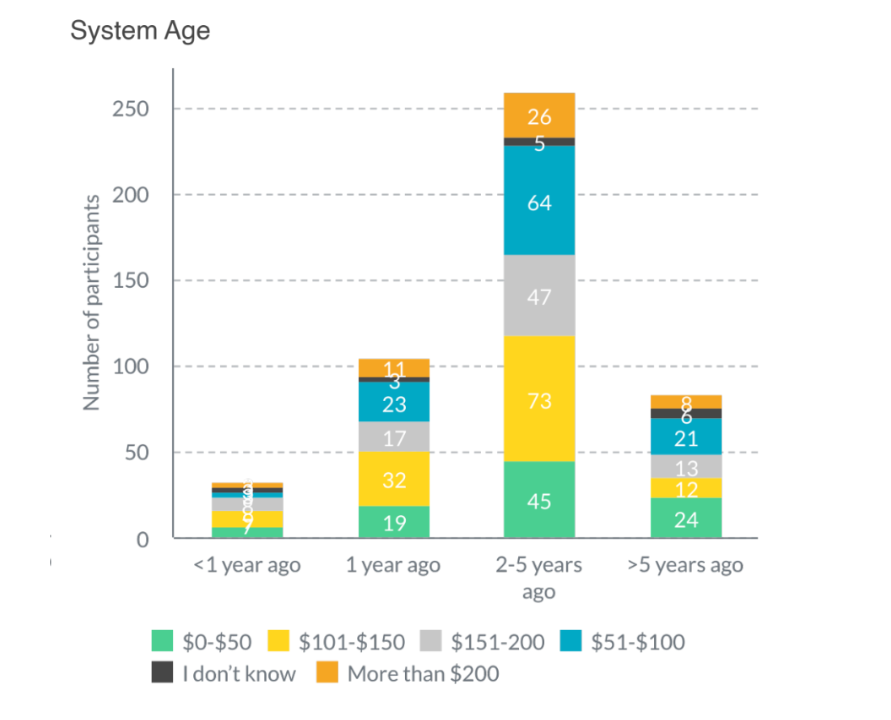
Most of those who purchased their system more than five years ago believe their savings are $0 to $50 and only a quarter of them consider their savings to be 50 to 100. Los Angeles and New York have a higher than average perception of savings. Especially New York where more than half consider their savings to range from $151 to $200. Additionally, higher income earners have a higher perception of savings than the average.
I am satisfied with my solar installer
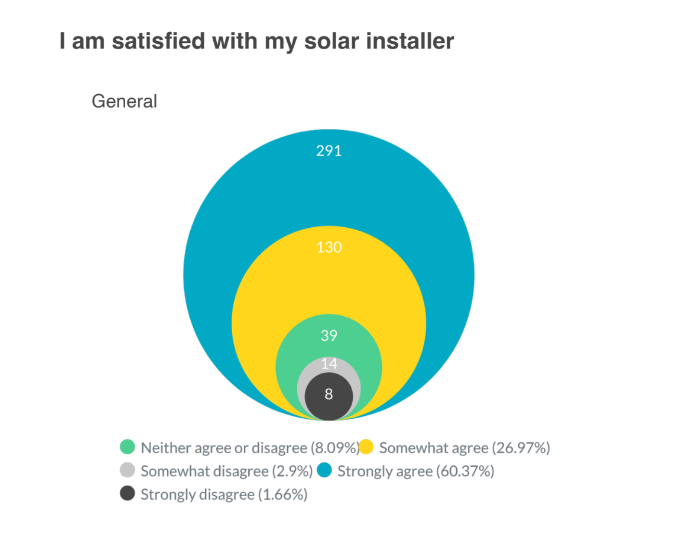
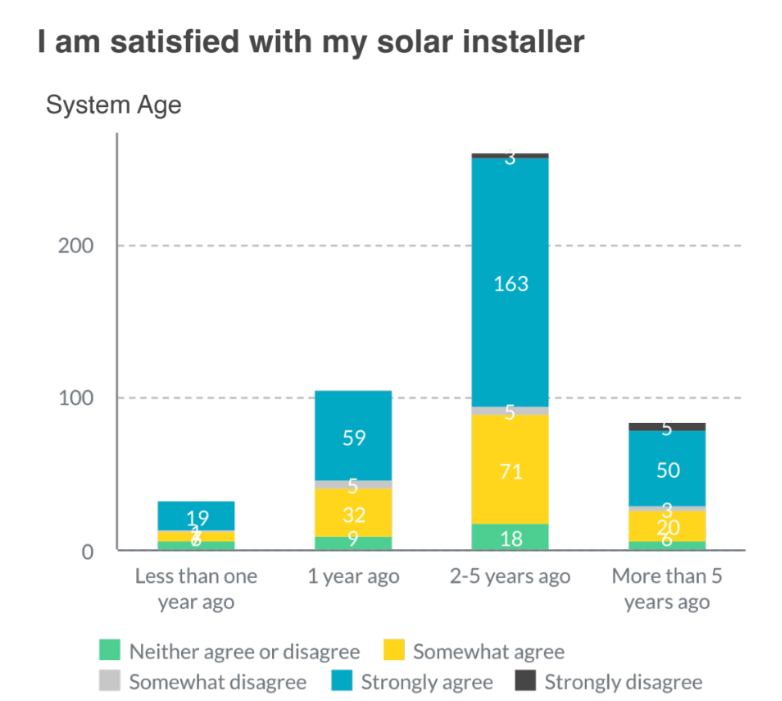
Over 87% of participants strongly or somewhat agree to the statement: “I am satisfied with my solar installer.” Over 4% either strongly or somewhat disagreed with the statement, indicating dissatisfaction with their solar installer experience. Slightly over 8% neither agree nor disagree, potentially indicating ambivalence toward their solar installation experience.
I am satisfied with my solar system monitoring app
The vast majority of participants reported being satisfied with their solar system monitoring app. 57.39% strongly agreed and 31.28% somewhat agreed to the statement “I am satisfied with my solar system monitoring app.” Around 3.45% strongly or somewhat disagreed with the statement.
Solar homeowners in the Inland Empire, Los Angeles, New York are above the average satisfaction rate. Participants in the Bay Area, Sacramento Valley, San Diego Valley and San Joaquin Valley are below the average satisfaction rate and are 5x more likely to be unsure of their satisfaction.
Notifications
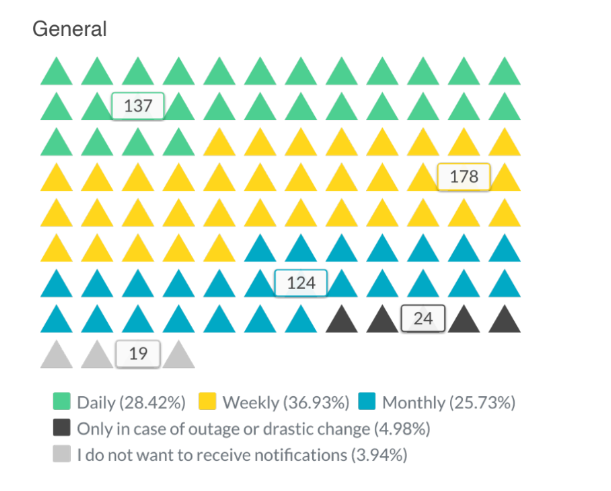
Among all participants, 36.93% wanted weekly notifications, 28.42% wanted daily notifications and 25.73% wanted monthly notifications. Over 4.9% of participants reported only wanting notifications during an outage or drastic change. The remainder did not want to receive notifications.
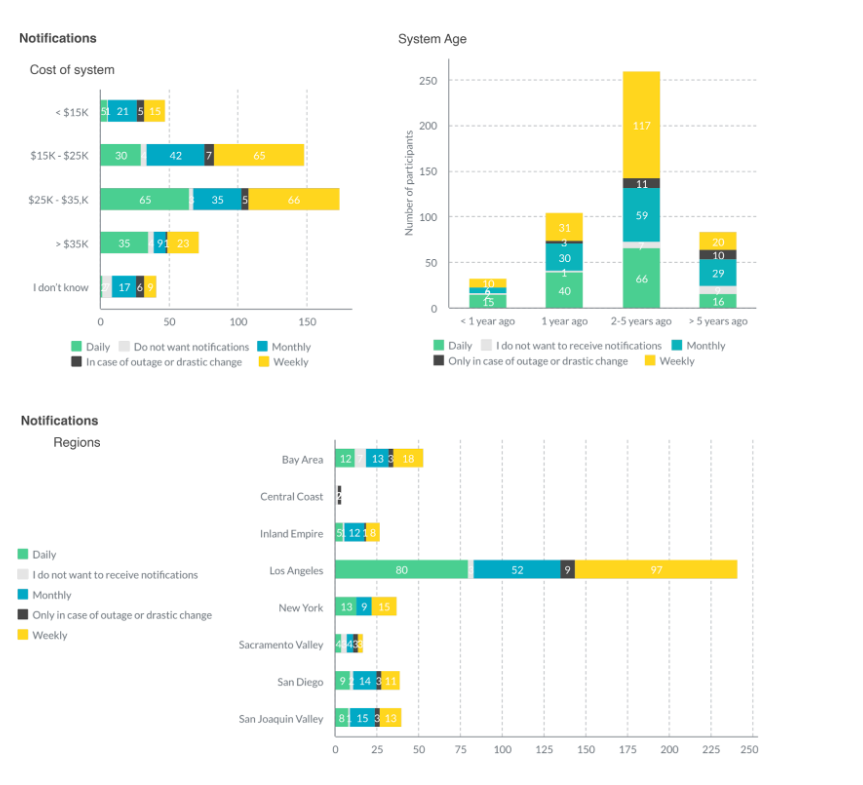
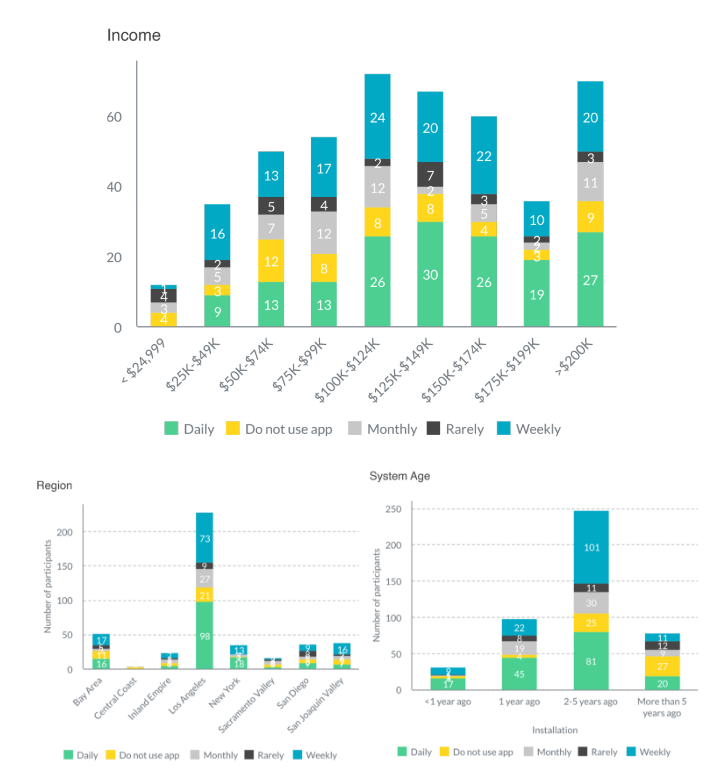
The higher the income, the more frequent participants would like notifications (daily/weekly). The newer the system, the more frequent they would like notifications (daily/weekly). Participants in the Los Angeles and Sacramento Valley regions were more likely to want daily notifications than other regions. As did owners of systems costing more than $35,000, who are three times more likely to want daily notifications.
How often do you use a solar system monitoring app?
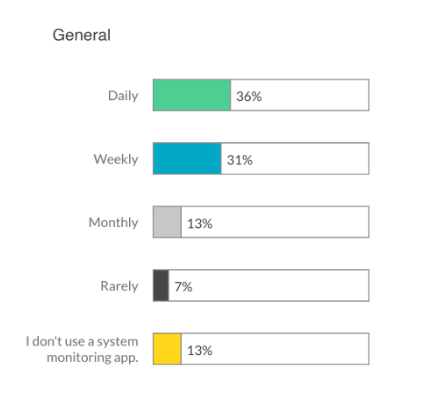
The plurality of participants use their solar system monitoring app daily or weekly — at 36% and 31%, respectively. Next, 13% used their monitoring app monthly and 7% rarely used their app. 13% of participants reported not using a monitoring app for their solar system.
The younger the demographic, the more frequent they want notifications about their systems. Our research found, owners of newer systems typically used their monitoring app more frequently. Higher-income participants also used their monitoring app more frequently. Participants in the Los Angeles region are two times more likely to use their app daily than other regions.
Has your solar system needed maintenance?
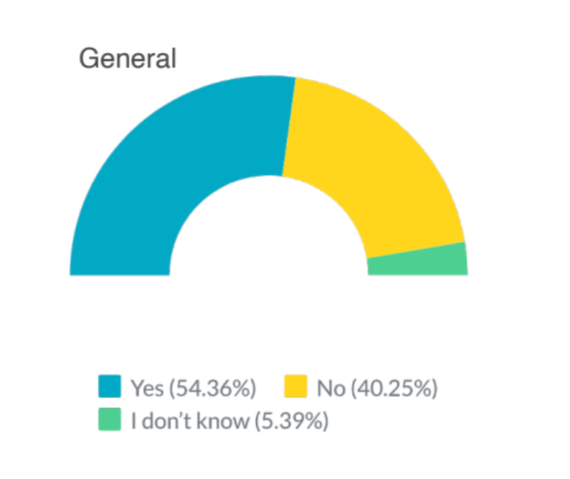
The general results found over 54% of participants needed maintenance. Over 40% of participants have not needed maintenance. The remainder did not know if their system needed maintenance.
Higher income earners are more likely to require maintenance, at 62.51% requiring maintenance for their system. The results of our survey found solar systems that cost over $25,000 are twice as likely to require maintenance as lower-cost systems. Over half of the systems purchased more than five years prior to the survey are maintenance free.
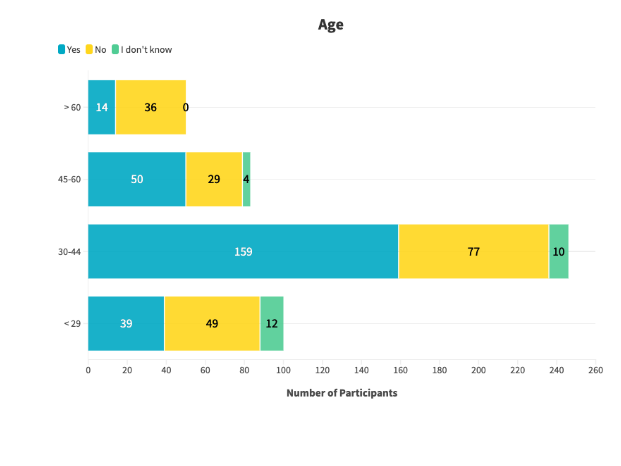
People between 30 and 60 years old are twice as likely to need maintenance as those younger or older. At least 12% in the 18-29 age range are unsure if their system has needed maintenance.
Additional Insights
The majority of respondents — 92.32% — agree to being satisfied with their decision to go solar.
Enact asked participants which renewable assets they were likely to purchase to upgrade their system, with options being: additional panels, battery storage, an electric vehicle and an EV charger. One-third of participants would add at least one asset to upgrade their system, primarily a storage battery, followed by more solar panels and only one-tenth would add all four.
Nearly 50% of participants would be willing to refer someone to go solar for a financial incentive over making an impact in the community/world.
Homeowners would prefer to have more information on how to save money rather than get answers or recommendations for solar products.
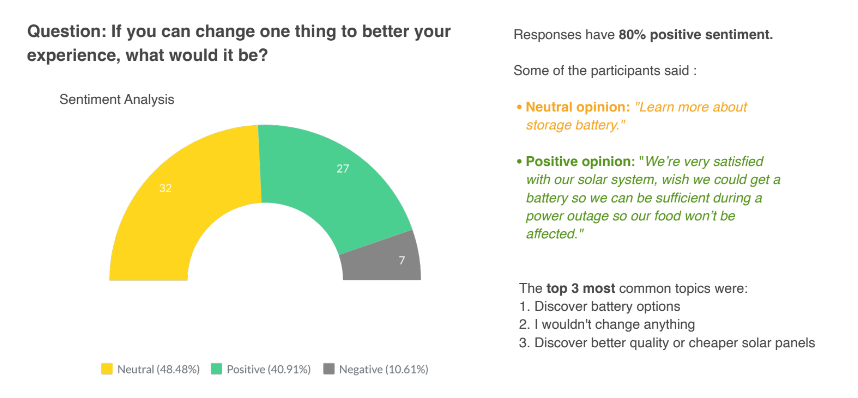
Question: If you can change one thing to better your experience, what would it be?
We asked our survey participants what one thing would they change to better their experience. Through a sentiment analysis, over 80% of responses had a positive or neutral sentiment. The sentiment analysis distribution found 48.81% of responses were neutral, 40.91% of responses were positive and 10.61% of responses were negative.
An example of a neutral response included “learn more about battery storage.” Another response with a positive sentiment said “we’re very satisfied with our solar system, wish we could get a battery so we can be sufficient during a power outage so our food won’t be affected.”
The most common participant response subject indicated wanting to discover more energy storage battery options. The second most common response showed participants would not have changed a thing in their solar purchasing journey. The third most common response subject expressed indicated wanting to discover better quality or cheaper solar panels.


