

Enact’s 2023 U.S. Solar and Storage Market Intelligence Report provides comprehensive insights into renewable energy adoption in the United States, focusing on trends, challenges, and the role of its two-sided platform in simplifying the process for consumers and empowering solar installers.
The report highlights the proliferation of energy storage options, varying pricing structures and California’s leadership in residential solar-plus-storage sales. It also discusses rising energy consumption patterns, improving ROI for solar and storage investments, and the importance of installer service quality. Enact’s report aims to be a valuable resource for stakeholders in the solar and storage markets, supporting informed decision-making and the global transition to clean energy.
Keywords: solar energy, energy storage, residential solar, commercial solar, California solar, solar installers
Letter from Enact CEO
The award-winning Enact software platform is designed to transform and accelerate the implementation of clean energy globally. Enact is the only two-sided platform that allows customers — both residential and commercial — to simplify their entire solar and energy storage purchase, designed on Enact and delivered by local solar professionals. Enact also enables thousands of professionals across the globe to deliver projects and manage assets for long-term performance.
As a true two-sided platform, Enact not only helps customers purchase solar and storage systems but also helps solar installers with the all-in-one cloud software platform to design and manage projects. Enact is operating in more than 35 countries, generating over 136.9 million kilowatt-hours (kWh) of renewable energy and 95,677 metric tonnes of CO2 offset by solar projects by 2023. The Enact Platform has over $996 million (USD) of projects proposed in the U.S., over $12.8 billion of projects proposed globally and over 110 megawatts (MW) of systems monitored, as of Dec. 31, 2023.
As the adoption of storage picks up in markets like California, driven by net metering (NEM) policy changes, consumers need to size their solar and storage solutions based on their true consumption needs and return on investment (ROI) goals. Consumers also face a difficult hurdle of choosing from a wide range of equipment options and a changing installer landscape that offers a wide range of service levels. As soft costs make up 50% or more of the total end-customer offer, the final pricing is all over the place. Buying solar and storage has never been harder than now and Enact is proud to be their trusted advisor on this transition, leading with trust and transparency.
We are proud to publish our first U.S. market intelligence data report, which provides great insights on solar and storage market trends for both residential and commercial segments. Key insights on project pricing, as well as customer ROI trends, should help current players and new market entrants navigate more effectively. We have also included trends for the U.S. residential end-consumer’s buying experience as well as installer service levels.
We appreciate your feedback on this report, please share your comments and suggestions to help us improve this for the next time!
Thanks,
Deep Chakraborty
CEO, ENACT SYSTEMS INC.
Key 2023 Market Insights
Proliferation in energy storage brand options
In the U.S. market, we saw more than a 100% increase in the number of energy storage brands being proposed on Enact between 2022 and 2023. With the advent of new storage brands and varying configuration options driven by size and type of solar/storage system sold, there has been a huge increase in complexity for consumers to navigate through, when making a buying decision.
For installers that are looking to scale-up, many struggled to manage their operations as they switched battery brands offered, as each product comes with its own learning curve for design, wiring and commissioning. While smaller installers might stick to a single battery option, mid-to-large players are offering three or more storage brands, which presents a new level of complexity for storage installation, maintenance and customer service teams.
Increasing spread in pricing across brands
Residential sales with storage paired with solar increased along with the proliferation in the number of storage brands in 2023. We witnessed a wide range of system price proposed with average pricing at ~$3.60 per Watt ($/W) and peak pricing at ~$5.85/W for the top 30 different combinations of solar panel, inverter and energy storage shown below, with smaller systems having a price premium compared with larger systems. In Figures 1 and 2, we show the ten most commonly used panel, inverter and battery combinations used for residential projects in 2023.
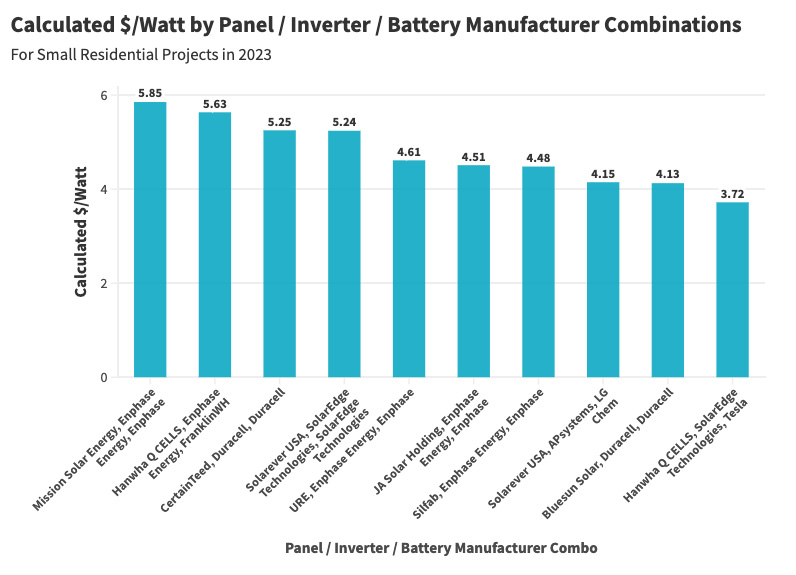
Figure 1: System pricing ($/W) for Solar-plus-Storage small residential projects (U.S.), based on equipment combinations
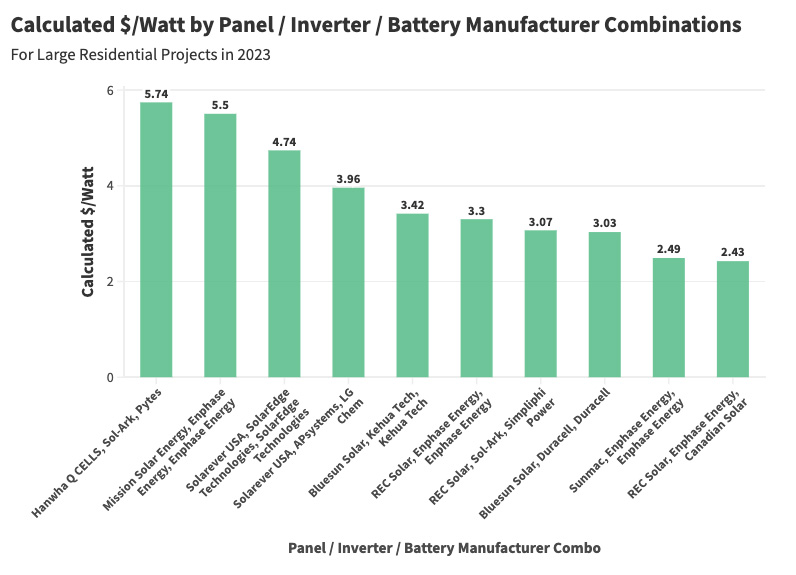
Figure 2: System pricing ($/W) for Solar-plus-Storage large residential projects (U.S.), based on equipment combinations
One of the factors impacting storage system pricing is the configuration of the system. Some consumers choose to use storage for time-of-use arbitrage only (no back-up). Others spend extra to ensure a partial / full home back-up circuit is also installed, which can be a few thousand dollars extra per home.
While California led the residential solar-plus-storage market sales on our platform, sales of solar-only systems were strong in many other states. For residential solar-only systems, we also noticed a wide range of pricing. For the top combinations of solar panels and inverters the average pricing at $3.33/W and peak pricing at $5.12/W.
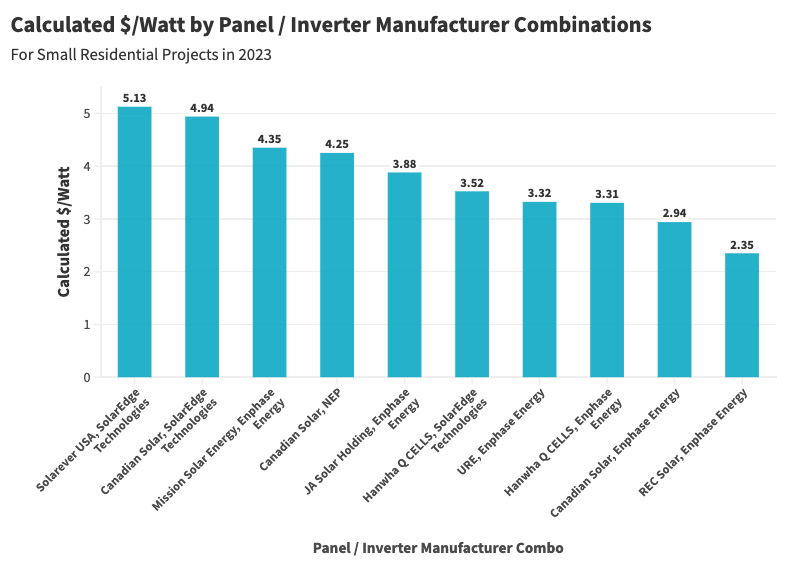
Figure 3: System pricing ($/W) for the top ten Solar-Only small residential projects (U.S.), based on equipment combinations
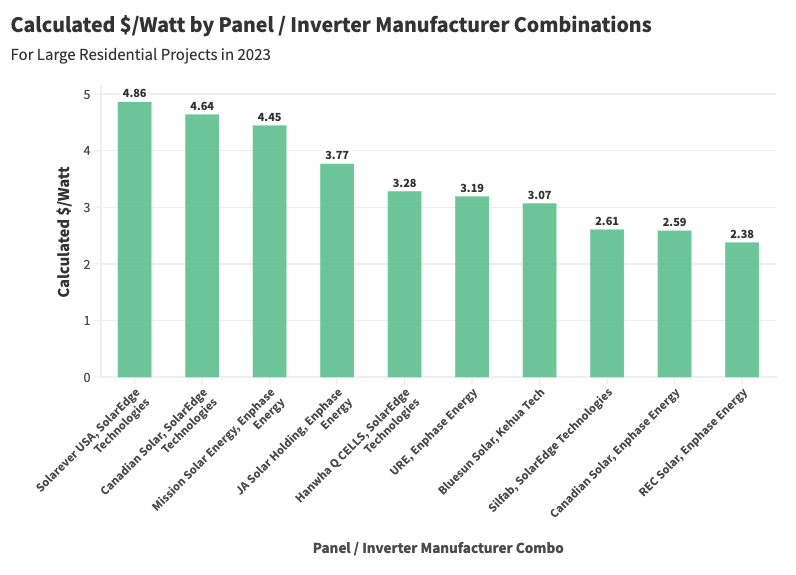
Figure 4: System pricing ($/W) for the top ten Solar-Only large residential projects (U.S.), based on equipment combinations
While SolarEdge and Enphase were the two dominant residential solar inverter brands in the U.S. market for our platform, we saw more than a 100% increase in the number of solar panel brands offered in 2023, compared to 2022, as several new entrants have arrived in the U.S. market, some with Made in USA panels.
For commercial systems for solar-plus-storage, we saw average system pricing for an average of $2.85/W and peak pricing of $4.19/W for the top 25 different combinations of solar panel, inverter and energy storage. The most commonly used manufacturer combinations for small and large commercial projects are shown below on Figures 5 and 6.
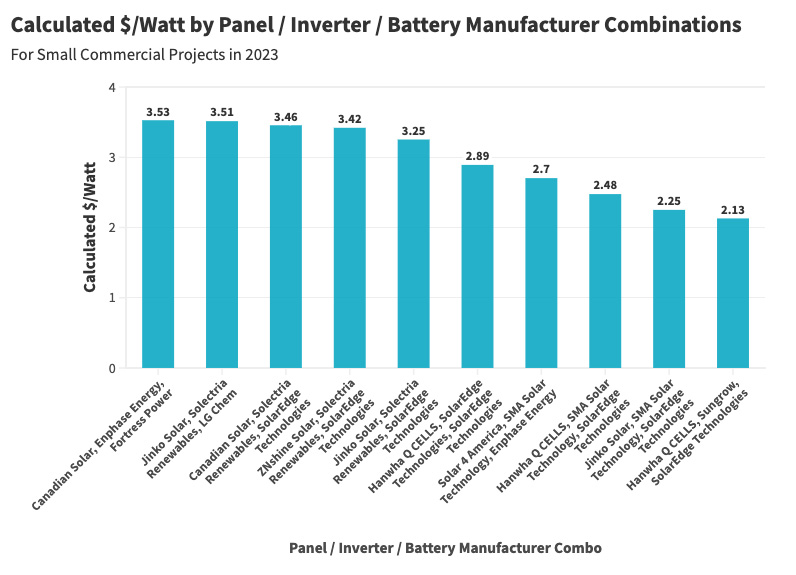
Figure 5: System pricing ($/W) for the top ten Solar-plus-Storage small commercial projects (U.S.), based on equipment combinations
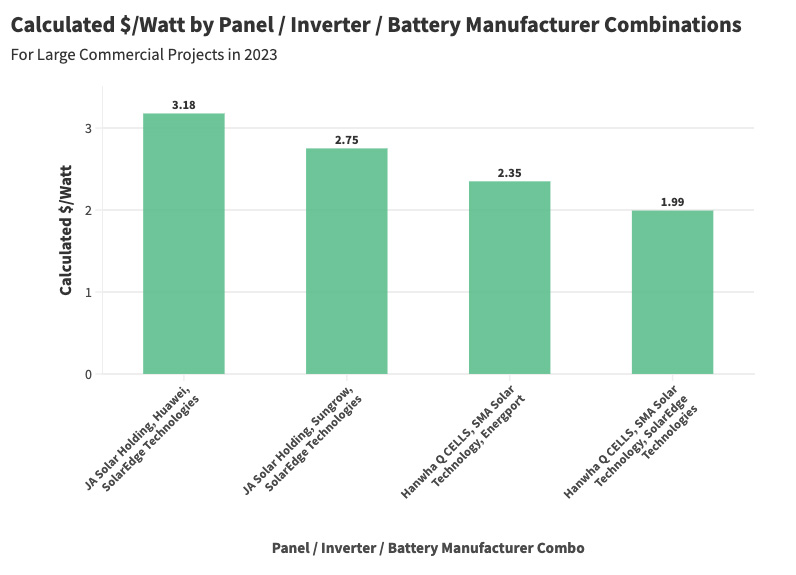
Figure 6: System pricing ($/W) for Solar-plus-Storage large commercial projects (U.S.), based on equipment combinations
The average price for commercial solar-only projects was $2.55/W and the peak price was $3.57/W across multiple solar panel / inverter combinations as shown below on Figure 7.
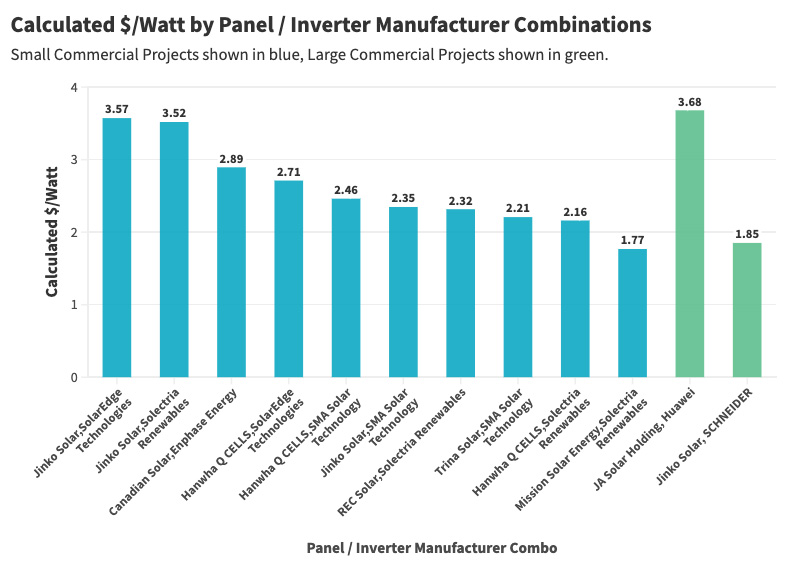
Figure 7: System pricing ($/W) for the top ten Solar-Only small commercial projects (U.S.) and the top large projects, based on equipment combinations
Increasing consumption patterns
As we compared the average consumer pre-project energy consumption with electric bill values for customers, we noticed a 5% increase in the median bill and a 37.72% higher pre-solar annual energy consumption level for customers seeking solar and/or storage options in 2023 when compared to 2022.
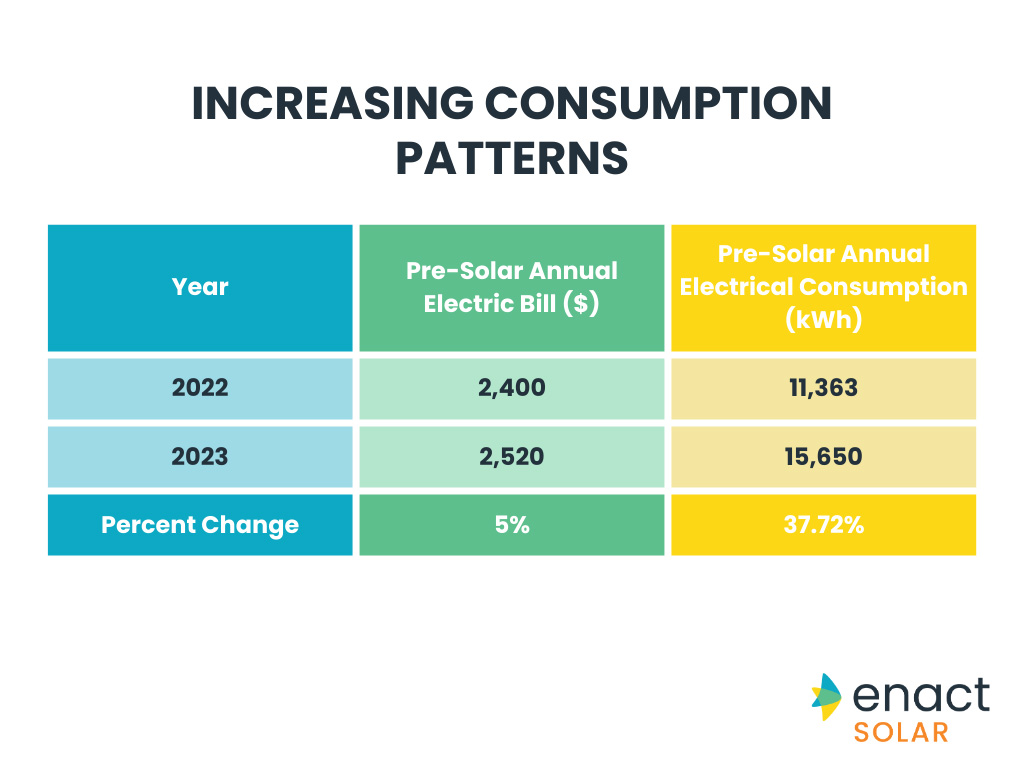
Figure 9: Average annual electric bill and consumption for clients seeking solar / storage solutions in the U.S., 2023 vs 2022
Increasing electric bills are a steady national trend from prior years, the higher energy-consumption levels of incoming customers can be explained by multiple factors — an increase of electric vehicle sales, growing use of electric appliances and increase in extreme climate events driving heating and cooling usage. Rising electric rates is also a national trend and consumers with high annual consumption (seeing larger bills) have a higher propensity to look for solar and storage solutions.
Improving Solar-plus-Storage ROI
Another major trend we have seen is the improving ROI of solar and storage investments. A classic example is the State of California, where the recent change in NEM policy has drawn a lot of attention. However, we found the payback period under NEM 3.0 for residential solar and storage in California is shorter at ~5.5 years in 2024 (NEM 3.0), compared to ~7.6 years for customers who signed on in 2023 (under NEM 2.0), as shown on Figure 10 below. These figures are based on an 8 kilowatt (kW) solar system with 100% energy offset, priced at $2.90/W, with a storage add-on priced at $13,000 for a 10 kWh battery, fully installed.
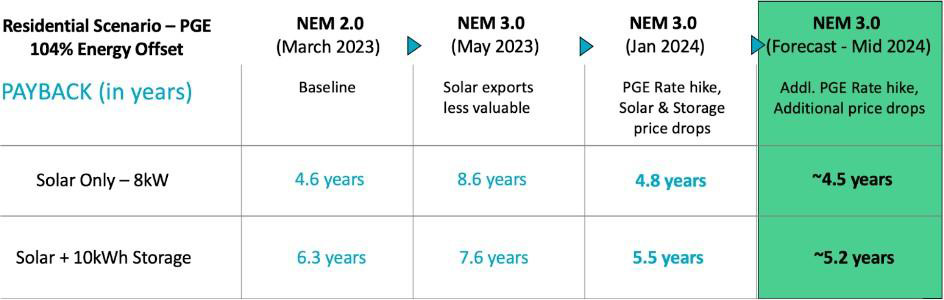
Figure 10: Payback, in years, for Solar-Only or Solar-plus-Storage investments under different net metering scheme, PG&E territory
Last year, California rolled out a new solar policy, called NEM 3.0 — which replaced the old net metering (NEM 2.0) system with net billing. Under the old scheme, homeowners could earn credits at market rates for extra solar energy they sent to the grid. Many homeowners often produced more electricity than they used. However, with the new net billing policy, the compensation for exported energy is significantly lower — around 75% less.
This change stirred some worry in the solar industry, as it seemed like going solar might not be as financially rewarding, which is clearly not the case. Even though the net export incentives have shifted, the NEM policy changes have not reduced the attractiveness of such investments — this is driven by two primary reasons: (i) a continued increase in utility grid prices and (ii) a continued drop in solar and storage hardware prices. Both of these factors have helped improve the customer value proposition.
Varying installer service levels
As Enact expanded its two-sided platform in the U.S. market, over 5,000 homes were serviced directly by Enact’s team with designs and offers for their solar and/or storage needs. Hundreds of homes completed installations in 2023, completed by installers enrolled in Enact’s partner program.
Enact partner rating aims to evaluate installers based on different criteria. These criteria are defined after extensive discussions and research with our domain experts. Our digital platform captures data at every step and this helps rate the customer journey and the installer’s quality of service. In 2023, we found a wide variance in service levels. As an example, just in California alone, amongst a selection of seven preferred installers, the best installer has a rating that was two times better than the worst performer.
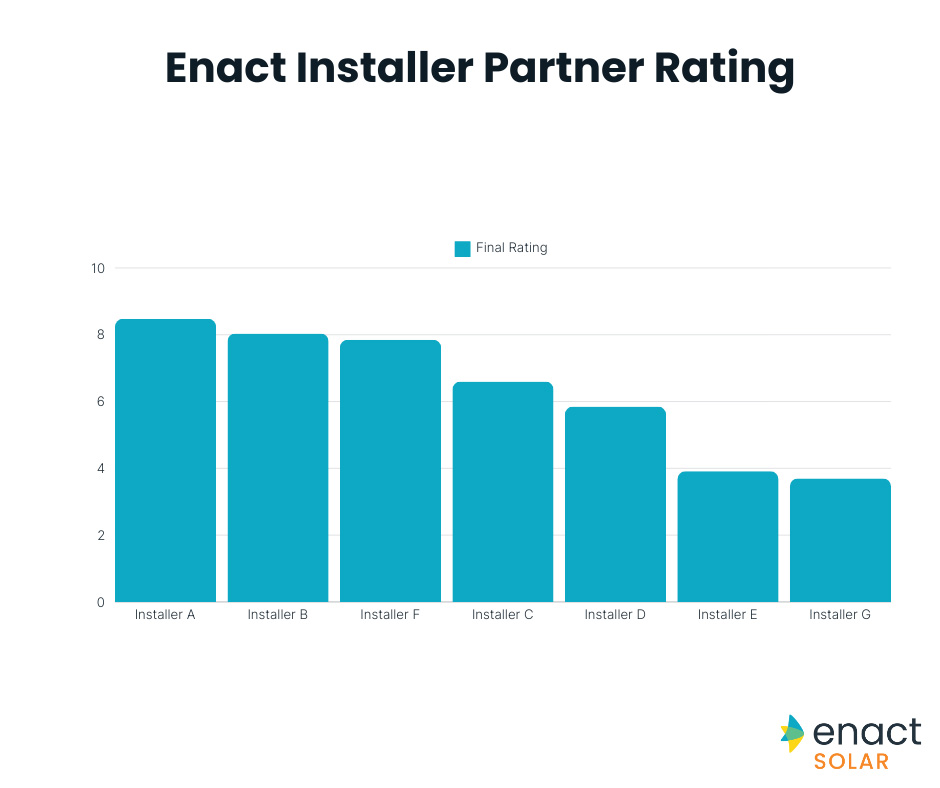
Figure 11: Ratings among seven solar installation businesses in California, each business is a member of Enact’s Insider partner program
The rating utilizes the criteria listed below, providing a rating between 0 to 10. This system facilitates the efficient matching of installers with projects, reducing the reliance on individual domain expertise. Moreover, it enables the identification of underperforming installers and offers insights into areas for improvement.
Enact’s rating criteria relies on multiple factors, including: days to the completion of survey, design, permit issuance, installation and PTO approval; and internal benchmarks.In formulating the rating system, we recognized the necessity for differential impact and that each criterion should not carry the same weight for the installer. Therefore, we assigned a weight to each criterion to reflect its importance, resulting in the final rating.
Summary
Last year was a year of transition for many U.S. solar installers, especially for those in California that had to navigate changing policies as well as tough marketplace dynamics due to high interest rates. Many installation companies went out of business and consumers are wary of choosing their installers without any third-party data and guidance.
Enact’s platform is helping consumers on this important step of their journey, not just providing independent design recommendations, but also vetting the installers that build their projects and ensuring projects delivered by them meet desired levels of performance and savings measured on the Enact Consumer App.
As the market intelligence data shows, the consumer’s transition to solar / storage has never been more challenging. While the good news is that their ROI is improving, thanks to falling storage equipment pricing and rising electric rates, the process to select the right solution for their home can be a daunting task.
Multiple factors — such as the growing number of equipment options, wide variance in final pricing and a huge spread in installer service levels — can make it difficult for consumer decision making on an expensive purchase for their home.
Enact’s platform offers trusted, independent advice and recommendations based on the consumer’s energy consumption needs and then selects the best, vetted installer in their local region, based on real data from past projects.
Contributors
Contributions to the Enact 2023 Solar and Storage Market Intelligence Report were made by Enact CEO & Cofounder Deep Chakraborty, Head of Product & Cofounder Manasij Kar, Data Strategy Associate Navya Mishra, Director of Sales (U.S.) Mark Chapman, Manager of Technical Services Marco Casalegno, Senior Manager of Marketing Shelly Littman and Marketing Associate David Bartle